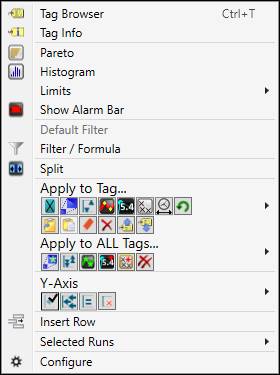
Right-click a tag’s row in the tag info grid to open the context menu. Note that any tag-specific options will apply to the tag whose row was right-clicked.
Tag Browser: Opens the Tag Browser.
Tag Info: Opens the Tag Info window.
Pareto: Opens a Pareto chart for all of the tags in the Tag Info Grid. The clicked-on tag will be the active tag in the chart. The Pareto chart uses the same timespan as the trend.
Histogram: Opens a Histogram chart for all of the tags in the Tag Info Grid. The clicked-on tag will be the active tag in the chart. The Histogram chart uses the same timespan as the trend.
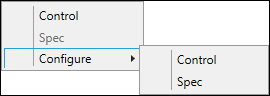
Limits: Toggles configured limits. If a limit is greyed out, then the limit has not been configured in PARCview. The configure menu allows the user to configure the limits for the tag. Clicking on a limit in the configure menu opens the Edit Tag Limit window and requires an admin password.
Show Alarm Bar: Toggles the Alarm Bar, which displays alarm events associated with a tag. Each trend tag can have its own alarm bar beneath the plot area. When limits are enabled for a tag, the alarm bar is also toggled on.
Default Filter: Applies the Default Filter for the selected tag. The filter can be configured in the Process tab or Process Tags tab of System Configuration.
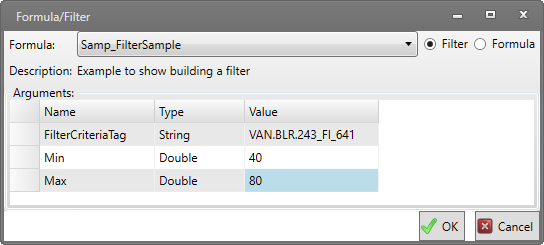
Filter/Formula: Opens the Filter Select window. A filter or formula can be selected to apply to the tag in order to filter out or modify values. Select a filter or formula and then enter any required arguments, if applicable. Filters and formulas can be created and modified in the Script Editor.
Split: Creates a two-trend clone of the existing trend. The top trend contains the selected tag and all tags above it and the bottom trend contains all other tags from the trend. If the first tag is selected no change occurs.
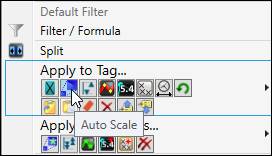
Apply to Tag: The apply to tag settings affect the tag whose row was right-clicked. Click an icon button, or open the popout menu and select an option. The icon buttons function like toggles: click once to enable, click again to disable.
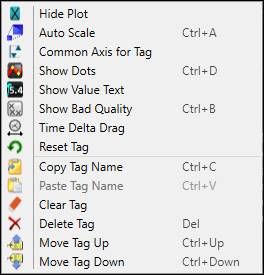
Hide Plot: Hides the trend plot in the plot.
Auto Scale: Changes Y-Axis scale of the selected tag based on minimum and maximum values of the selected tag in the trend so that all the data nicely fits in the window. Useful if values are outside of the tag’s typical range, or if values vary over a wide range over time.
Common Axis for Tag: Force all tags to use this tag’s plot min and max.
Show Dots: Shows a dot on the trend line at the timestamp of all real data points.
Show Value Text: Shows the value and timestamp for each data point in the trend. The value text only appears on the plot if there is enough space between points for the text to fit. For trends with many data points zooming may be required to see the value text.
Show Bad Quality: Adds a bad quality marker for each bad quality data point for the specified tag in the trend.
Time Delta Drag: Allows the x-axis to be shifted by dragging for the selected tag. Shifting the axis displays the tag using a different time frame than the other tags. This is useful for viewing correlations that are offset by a certain amount of time. The delta time shift is NOT reset when this setting is disabled.
Reset Tag: Resets the following tag properties to defaults: PlotMin, PlotMax, Description, Tag Name, Units, Interpolation, Data Type, Draw Mode, Tag Extension, Delta Time Expression
Clear Tag: Removes the tag, leaving a blank row.
Delete Row: Removes the tag and the row.
Move Tag Up: Moves the tag up one row in the tag info grid. The order of the tags in the tag grid affects the order in which trend lines are drawn (z-order), with tags lower on the list being drawn on top of those higher on the list.
Move Tag Down: Moves the tag down one row in the tag info grid. The order of the tags in the tag grid affects the order in which trend lines are drawn (z-order), with tags lower on the list being drawn on top of those higher on the list.
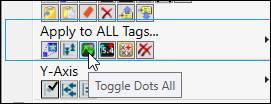
Apply to All Tags: The apply to all tags settings affect all tags in the trend. Click an icon button, or open the popout menu and select an option. The icon buttons function like toggles: click once to enable, click again to disable.
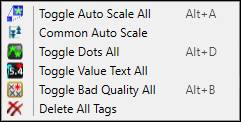
Toggle Auto Scale All: Auto-scales all tags.
Common Auto Scale: Force all tags to use the same value range while still fitting all values within the plot area. Same as the Common Axis property.
Toggle Dots All: Shows dots for every value in trend.
Toggle Value Text All: Shows value and timestamp for all data points for all tags.
Toggle Bad Quality All: Shows bad quality markers for all tags.
Delete All Tags: Deletes all tags and returns to the number of rows configured in the Tag Info Grid properties.
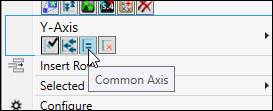
Y-Axis: The Y-Axis settings affect the value ranges (plot min and max) used by the trend. Click an icon button, or open the popout menu and select an option. The icon buttons function like toggles: click once to enable, click again to disable.
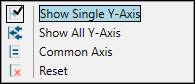
Show Single Y-Axis: Show the value range for one tag at a time. The range shown is for the tag selected in the Tag Info Grid.
Show All Y-Axis: Show values ranges for all tags. Though this takes up more screen real estate, it is more useful for printing and screen shots.
Common Axis: Force all tags to use the same value range while still fitting all values within the plot area.
Reset: Reset the Y-axis to its initial state.
Insert Row: Inserts a blank row at the clicked on position and move all tags beneath it down one row.
Selected Runs: Retrieves and plots saved runs as box and whisker plots. Saved runs are managed through Centerline and the Run Browser.
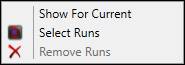
Show For Current: Displays Box and Whisker plots of selected grade runs for the current grade, based on the selected tag’s Process Area grade tag.
Select Runs: Opens the Manage Selected Runs form with the target tag preloaded. Box and Whisker plots of runs saved for the selected tag can be loaded in the Trend.
Remove Runs: Remove the currently plotted selected runs.
Configure: Opens the Trend Properties window on the Tag Config tab.