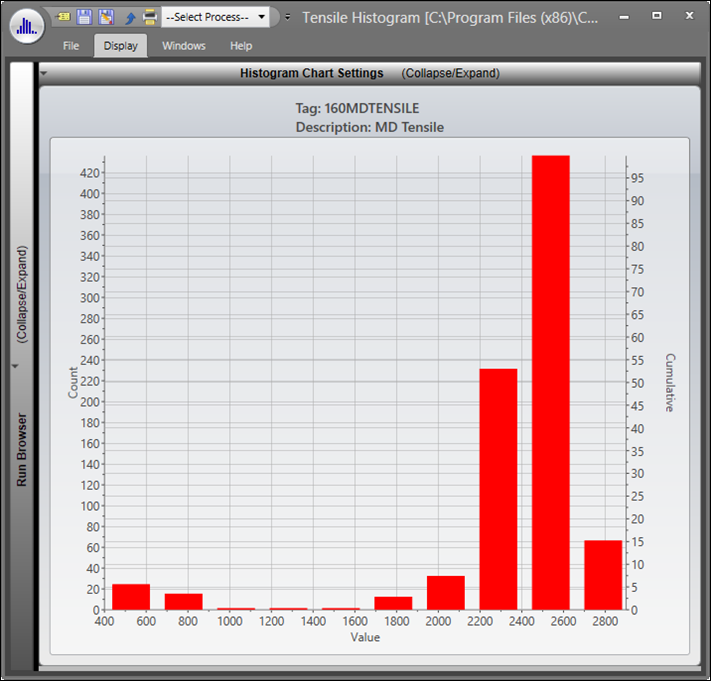
A Histogram is a chart that plots the frequency of values in a tag. The Y-Axis consists of the frequency (either count or percentage) and the X-Axis consists of the tag value ranges being plotted.
Related Links:
Launching Histogram Charts
Application Button
Quick Access Toolbar
Ribbon Bar
Run Browser
Histogram Chart Settings