
The Ribbon Bar is located at the top of the PARCview screen and contains four ribbons of categorized Display buttons and Tools.
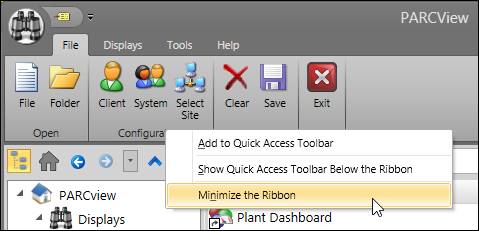
To hide the ribbon icons, right-click on part of the ribbon bar and click Minimize the Ribbon. To restore it, right-click on the ribbon bar and uncheck Minimize the Ribbon. This feature can also be accessed from the Quick Access Toolbar.
The file ribbon contains the most fundamental operations in PARCview, and has essentially the same features as the Application Button.
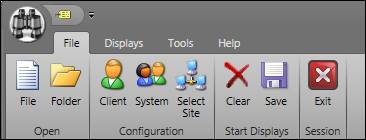
•File: Opens PARCview’s custom File Browser.
•Folder: Opens PARCview’s custom Folder Browser.
•Client: Opens the Client Configuration window.
•System: Opens the System Configuration window.
•Select Site: Opens Select Site to specify the database connection and Displays directory.
•Clear: Clears saved startup displays.
•Save: Saves open displays as PARCview’s startup displays.
•Exit: Closes PARCview and all open PARCview windows.
Most of the buttons on the display section of the ribbon launch a blank display of the type selected. The Tag Browser button launches the tag browser available in many windows of PARCview where tags can be found and selected for analysis.
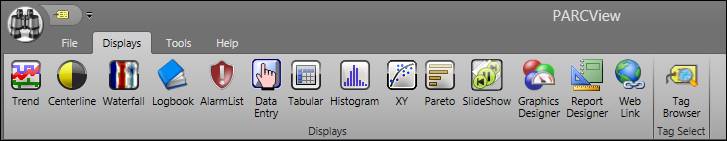
•Trend: Opens a new Trend display to show plotted data.
•Centerline: Opens a Centerline display to track the main operating variables.
•Waterfall: Opens a Waterfall display to show profile data, such as from a scanner on a paper machine.
•Logbook: Opens PARCview’s Logbook with no area selected.
•Alarm List: Opens an Alarm List of current and past alarms where reasons and comments can be assigned.
•Data Entry: Opens a new Manual Data Entry display.
•Tabular: Opens an empty Tabular chart display, which shows tag data in a table format.
•Histogram: Opens a new Histogram chart to show the distribution of a tag’s data .
•XY: Opens a new XY chart to show the relationship between two tags as a scatter plot.
•Pareto: Opens a new Pareto chart that displays individual values as well as a cumulative total.
•Slideshow: Opens a window to configure a new SlideShow to display a sequence of PARCview displays.
•Graphics Designer: Opens the PARCgraphics Designer where custom displays using live process data can be created and viewed.
•Report Designer: Opens the PARCreport Designer where SQL-based reports can be created to be viewed in PARCview or distributed via PARCtask.
•Web Link: Opens a Web Link display where a link to a specific website can be created as a display in the folder tree.
•Tag Browser: Opens the Tag Browser to find tags. Drag tags from here to various displays.
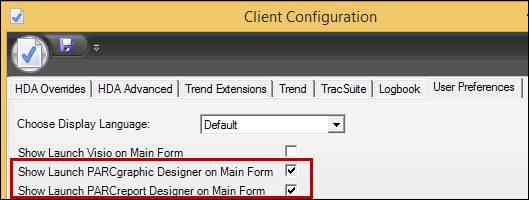
Several Displays are not shown in the Displays Ribbon by default, including Graphics Designer and Report Designer. To enable these icons, click File then Client to open the Client Configuration window and then check Show Launch PARCgraphic Designer on Main Form and Show Launch PARCreport Designer on Main Form in the User Preferences tab.
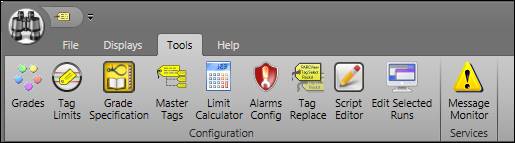
•Grades: Opens the Grade Maintenance window where all grades can be created and viewed.
•Tag Limits: Opens the Edit Tag Limits window where limits and targets can be set for individual tags.
•Grade Specification: Opens the Grade Specification window where limits can be configured by grade for multiple tags at once.
•Master Tags: Opens the Master Tag Editor where master tags can be configured.
•Limit Calculator: Opens the SQC Limit Calculations window to calculate standard SQC limits for a given tag.
•Alarm Config: Opens the PARCalarm Configuration window where alarms can be created and modified.
•Tag Replace: Opens the Tag Search And Replace window where tags utilized in displays can be replaced with other tags.
•Script Editor: Opens the Script Editor window to create calculated tags and edit expressions, simple formulas, and advanced formulas.
•Edit Selected Runs: Opens the Edit Selected Runs window where saved runs can be viewed and modified.
•Message Monitor: Turns on the PARCmessage error handling service. Access PARCmessage in the system tray.
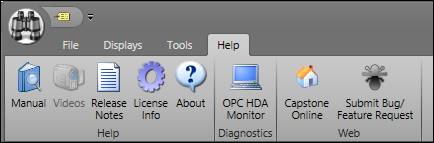
•Manual: Displays the help file with documentation for the PARCview program.
•Videos: Opens a set of help videos for specific features and actions in PARCview.
•Release Notes: View the list of changes in the current version as a web page.
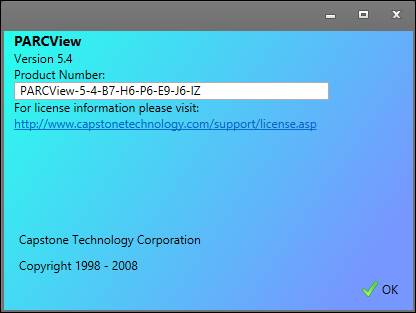
•License Info: Displays the version and product number currently licensed.
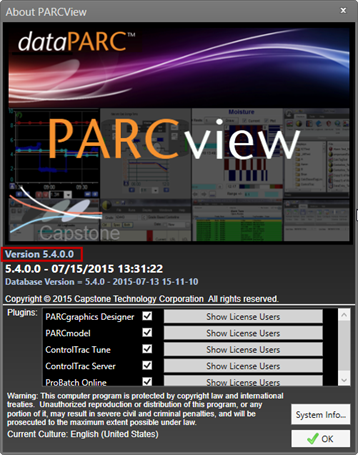
•About: Displays version of PARCview as well as licensed plugins.
•OPC HDA Monitor: Opens the OPCHDA Server Monitor that displays memory usage and the status of current client-server connections.
•Capstone Online: Opens the home page of the Capstone Technology website in the default web browser.
•Submit Bug/Feature Request: Opens to the dataPARC Support Portal in the default web browser.