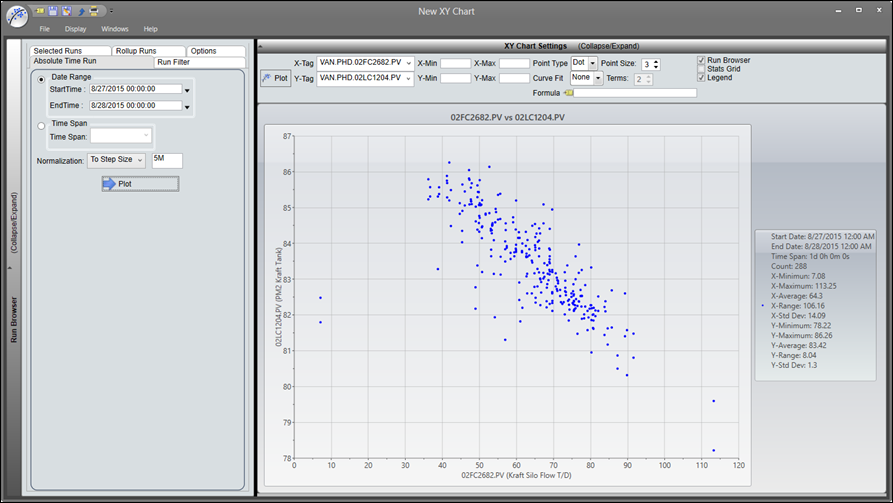
The X/Y chart shows the relationship between two tags as a scatter plot. The title at the top of the chart shows the X-axis tag ID versus the Y-axis tag ID. The X- and Y-axis will show the display ID as the axis title. The numbering on each axis will be the smallest range while still showing all of the data points in the chart.