
These settings control how the scatter plot data is displayed.
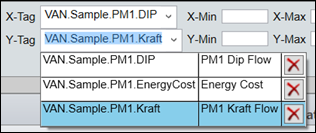
•Selecting X and Y Tags: To add tags to an X/Y chart, drag them from the Tag Browser or other displays into the X- and Y-Tag fields (they can also be dragged directly onto the chart area).

To switch the currently selected X- or Y-tag, open the drop-down menu and select a different tag. All of the tags added to the X/Y chart are available in both menus. Click the red “X” to remove a tag.
•Plotting Tags: Click the Plot button to retrieve tag data based on the X/Y chart’s current settings. If changes to the settings require the data to be re-plotted, the button will glow green.
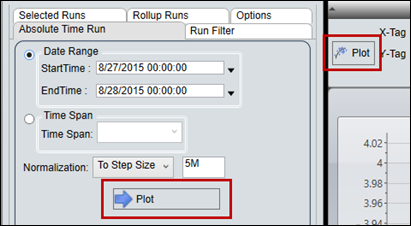
•Filters: Filter out values of the X- or Y-tag using the X-Min, X-Max, Y-Min, and Y-Max fields. Enter the minimum or maximum values to include in the chart.

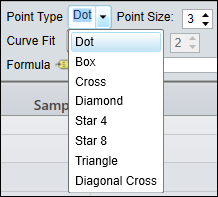
•Point Type and Size: Configure how points are drawn on the chart. Choose a point type and size.
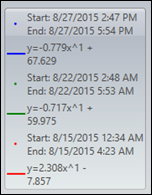
•Curve Fit: Various types of formulas can be plotted on the chart to describe the relationship between the X-tag and Y-tag. Select a formula type from the Curve Fit menu. The Polynomial, Exponent, Logarithmic, Power, and Fourier Curve Fits can use a custom number of terms.

•Formula: The Formula field shows the resultant equation.

The Formula and the R-Squared are shown in the Legend.

To trend the formula as a calculation of the X-tag, click and drag the tag icon onto a Trend.

These checkboxes control the visibility of additional information on the X/Y chart.

•Run Browser: This checkbox toggles the visibility of the Run Browser panel. Also, clicking on the edge of the panel where it says “Run Browser (Collapse/Expand)” or on the Show/Hide Run Browser option available in the right-click menu will open and close the panel.
•Stats Grid: Check this to show information about the dates, times, X and Y averages, ranges, and standard deviation. When a Curve Fit is selected, the formula and R-Squared field will be filled as well.

When the X/Y chart contains multiple runs (more than one span of time), each run has its own column. Right-click the colored header of a column to hide the plot for that tag.

•Legend: Check Legend to show information about the dates, times, X and Y averages, ranges, and standard deviation. When a Curve Fit is selected, the formula and R-Squared value will be shown as well.

When the X/Y chart contains multiple runs, the legend shows the color-coding and start and end times of the runs. All of the other information that is displayed for one run can be found in the Stats Grid when it is checked.

When right-clicking anywhere on the chart display portion of the X/Y chart window, a menu will appear with two options:
•Show/Hide Run Browser: This will open and close the Run Browser panel.
•Trend: This will open a Trend with the X- and Y-axis tags of the chart being shown in the Trend.