Create alarm definitions using logic controls by following these steps (note that the order of operations is not necessarily strict):
1. Determine the logic of the alarm definition.
2. Select the appropriate controls to create the alarm definition.
3. Add the controls to the canvas.
4. Connect the controls.
5. Configure the controls as needed.
6. Save resultant calc tags and alarm definitions using the Logic Design Manger.
Types of Controls
Logic controls interact with each other by accepting an input or inputs from other controls and then providing an output to other controls. Depending on the type of logic control, it will support only an output, only an input, or both an output and an input or inputs.
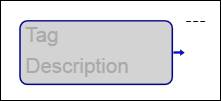
Tag controls and the constant control only provide an output to other controls, as they are a starting point of the alarm definition logic. The input for these controls is a tag value or a manually entered constant value.
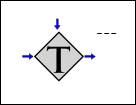
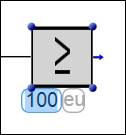
Evaluation controls support both an input or inputs and an output. The control may accept additional configuration to specify the conditions of the evaluation.
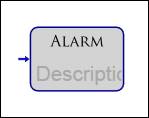
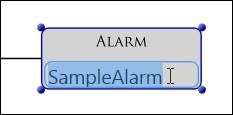
Alarm controls only support an input, as they are the end point of the alarm definition logic.
Terminology
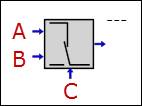
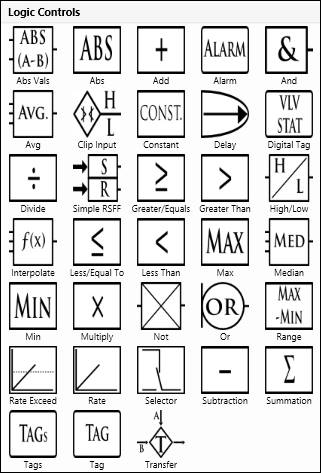
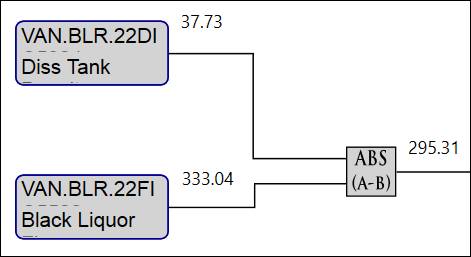
For certain controls that accept multiple inputs, such as the Subtraction control and the Transfer control, the order of the inputs is not arbitrary. In these cases, the top left input is the first input, or “input A”, and the bottom left input is the second input, or “input B”.
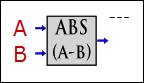
If the control requires three inputs in a specific order, then the bottom input is “input C”.
Controls that evaluate one of the conditions within the alarm logic will have one of two outputs: an alarm condition of “true” or “1”, or an alarm condition of “false” or “0”. A final alarm condition of “true” indicates an alarm state has occurred.
Color Change Behavior
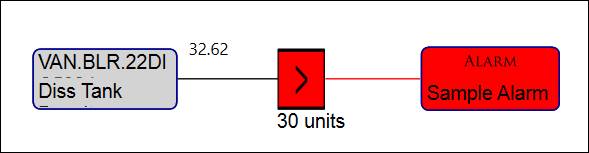
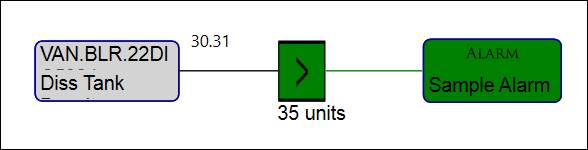
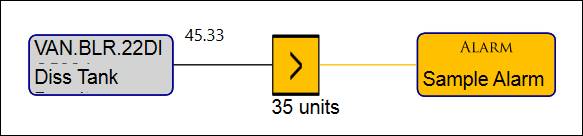
When an evaluation control outputs an alarm condition, it along with its output line will change color to reflect that condition. A red color indicates an alarm condition of true, while green indicates an alarm condition of false.
The alarm control will also change color to indicate the final alarm condition.
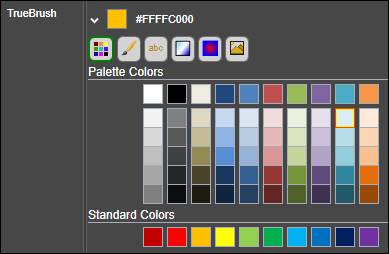
The colors associated with the alarm conditions can be changed by modifying the TrueBrush or FalseBrush properties.
Adding Controls
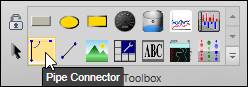
The logic controls are located in in the control toolbox.
Logic controls are added to the canvas just like any other type of control. Either drag and drop the control from the control toolbox onto the canvas, or select the control and then draw the control on the canvas. Dragging and dropping has the benefit of ensuring all controls will be consistently sized automatically.
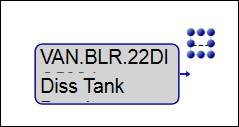
Controls that can display a value have an associated PVTextBlock control that is added automatically when the logic control is added to the canvas. Note that the logic control and the PVTextBlock control are not grouped together, so they must be moved simultaneously in order to maintain their relative positions.
Warning: Do not copy/paste logic controls that have an associated PVTextBlock.
Connecting Controls
Use the pipe connector control to connect a control’s output to another control’s input.
Click the pipe connector icon in the control toolbox to start drawing the pipe connector.
Next, click and hold on the output of a logic control, then drag the pipe connector to the input of a logic control. If the pipe connector requires more segments to make the connection, hold CTRL and click/drag the endpoint to add another segment.
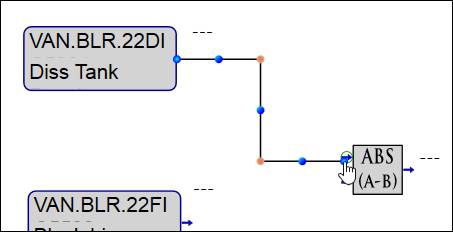
Once the controls are linked together, either control may be moved without breaking the link.
Configuring Controls
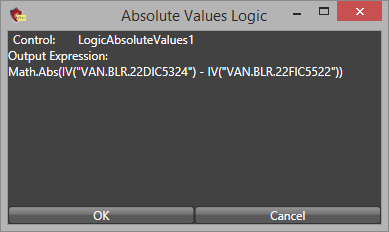
In some cases, simply connecting two logic controls completes the logical step. If a logic control requires additional configuration, a tool icon will appear above the control when it is selected.
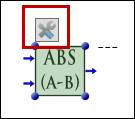
Click the icon to open the control’s configuration window.
Other controls may be configured by double-clicking the control after it is selected to directly edit a value.
The configuration window will vary from control to control. See Control Descriptions for more information.
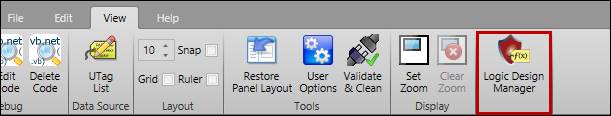
Use the Logic Design Manager to view the alarm definitions contained within the graphics display, to modify the properties of the resultant CALC-source tag and alarm definition, and to save the new CALC-source tag and the alarm definition to the dataPARC configuration database. The Logic Design Manager can also be used to view a list of all graphics displays that contain alarms defined through logic controls.
To open the Logic Design Manager, click the icon on the view tab:
Note that the display must be saved before the Logic Design Manager can be opened.
The Logic Design Manager is protected by the PARCAlarm Configuration password or the corresponding PARCsecurity role.
The Logic Design Manager has two tabs: Logic and Display, and a ribbon with an Edit Tab.
Edit Tab
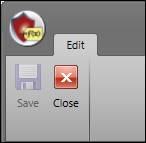
Save: Saves changes. Disabled if there are no changes to be saved or if required fields are missing values.
Close: Closes the window.
Logic Tab
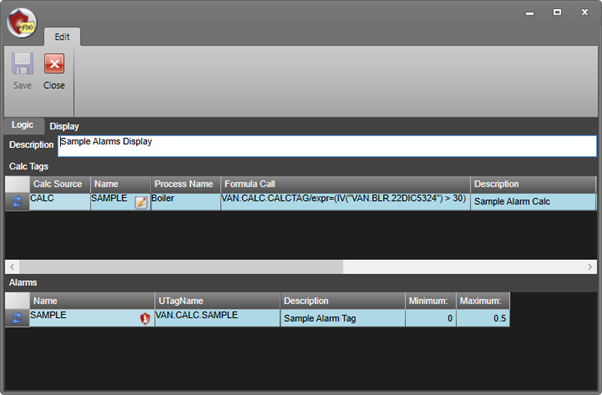
The Logic tab shows the description of the graphics display, a list of the CALC-source tags resulting from the construction of alarm definitions with logic controls, and a list of the corresponding Alarms.
Description: The description of the graphics display. Specified here or on the Display tab.
Calc Tags Grid: Lists the resultant calc tags in the graphics display.
Status: Indicates the state of the calc tag row. The
plus icon  indicates a new unsaved calc tag.
The refresh icon
indicates a new unsaved calc tag.
The refresh icon  indicates the row contains
information retrieved from the database. The pencil icon
indicates the row contains
information retrieved from the database. The pencil icon  indicates the saved record has
been modified.
indicates the saved record has
been modified.
Calc Source: Specify the CALC-type source to which the calc tag will belong. Open the drop-down menu and select from the available sources. Sources are configured in System Configuration.

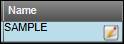
Name: The TagID (short name) of the resultant calc tag. Manually type the name of the tag here. The value entered in this field will automatically populate the corresponding Name field in the Alarms section. The red border indicates this field has an invalid value. Hover over the pencil icon to see a tooltip describing the error.
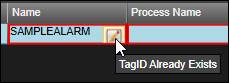
When a TagID is entered, click the tag icon to verify the tag name is valid.
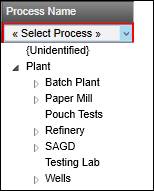
Process Name: Specify the process area to which the calc tag will assigned. Open the drop-down menu and select from the available process areas. Process areas are configured in System Configuration.
Formula Call: Displays the expression that determines that calc tag’s value.
Description: Specify the tag description.
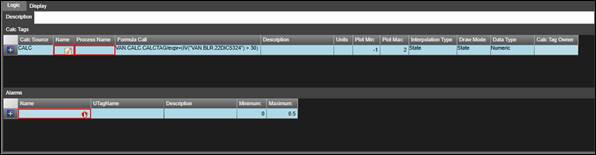
Units: Specify the tag’s units.
Plot Min: Specify the default minimum Y-axis value to use when trending the calc tag.
Plot Max: Specify the default maximum Y-axis value to use when trending the calc tag.
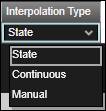
Interpolation Type: Specify the interpolation type of the calc tag. The default is state, as the calc tag will function like a Boolean (0/1).
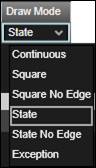
Draw Mode: Specify the draw mode of the calc tag. The default is state, as the calc tag will function like a Boolean (0/1).
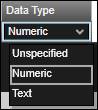
Data Type: Specify the data type of the calc tag. The default is numeric, as the calc tag will have numeric values.
Calc Tag Owner: If PARCsecurity is enabled, this field indicates the identity to which ownership of the Calc Tag has been assigned.
Alarms Grid: Lists the resultant alarm definitions in the graphics display.
Status: Indicates the state of the alarm definition
row. The plus icon indicates a new unsaved alarm
definition. The refresh icon indicates the row contains
information retrieved from the database. The pencil icon indicates the saved record has
been modified.
Name: The name of the resultant alarm definition.
This field automatically populates based on the value in the Name field of the
Calc Tags grid. Click the alarm icon  to open Alarm Configuration.
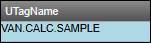
UTagName: The fully qualified name of the resultant calc tag. Populates automatically when the calc tag and alarm definition are saved.
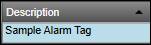
Description: Specify the alarm description.
Minimum: The minimum threshold. The default value is 0, which is equivalent to the calc tag’s value that indicates the alarm conditions are false.
Maximum: The maximum threshold. The default value is 0.5. The calc tag’s value that indicates the alarm conditions are true is 1, which will violate this threshold, thereby triggering the alarm.
Display Tab
The display tab lists all saved graphics displays that contain alarm definitions created using logic controls. This is intended to help keep track of the source of alarm definitions.
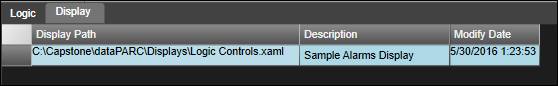
Display Path: The local or UNC path to the saved display.
Description: Specify a custom description for the display. Correlates to the description field on the Logic tab.
Modify Date: The datetime of the last save event.
Viewing Alarms
Logic controls in a running PARCgraphics display may be used to visualize and monitor alarms, but it should be noted that:
•PARCalarm Server must be running in order for alarm events to be automatically generated.
•A logic control that indicates an alarm has occurred does not necessarily reflect an underlying alarm event in the dataPARC configuration database.
•Logic controls cannot be used to assign reasons or comments to alarm events.
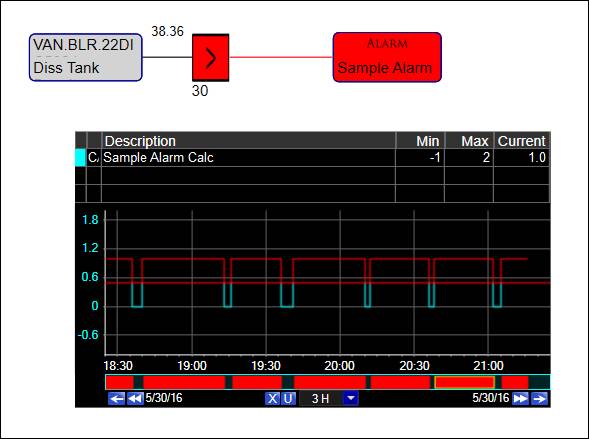
Actual alarms can be viewed throughout PARCview, including in Alarm Lists and Trends.
A trend embedded in a graphics display that contains logic controls can be used to view the alarm events as they occur.