
The Tag Info Grid lists the tags contained in the Trend. The order of the tags in the tag grid affects the order in which trend lines are drawn (z-order), with tags lower on the list being drawn on top of those higher on the list. Place “noisy” tags higher in the list so that they do not overwrite other tags.
Column Descriptions
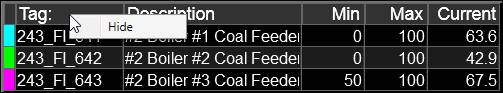
Trend Line Colors: The colored box is the color that the trend line appears in the plot. Right-clicking on the colored box change opens a color picker to change the color. Clicking on the colored box hides the tag. Hold Ctrl and click the color box to hide all Trend Lines other than the one selected. A black “X” appears when a trend line is hidden.
Tag Name: The name of the tag being plotted by the Trend. Clicking on the Tag Name allows the user to change which tag is displayed by typing in a Tag Name. A modifier, such as a filter or formula can be added to the end of a Tag name to change how the information is displayed on the trend.
Description: The description of the tag. Double-clicking on the Description opens a popup trend for the tag.
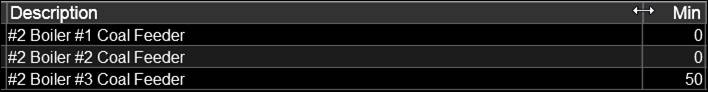
Plot Min and Max: The minimum and maximum values of the Y-axis. Changing these values changes the range of the Y-Axis. This only affects this trend and does not affect the tag’s native properties.
Current Value: The current value of the tag.
Units: A Units column can be enabled in the Tag Info Grid tab of the properties menu which displayed the units for the tag.
Marker Columns
When Markers are enabled up to 6 more columns can appear depending on the Tag Info Grid Properties.
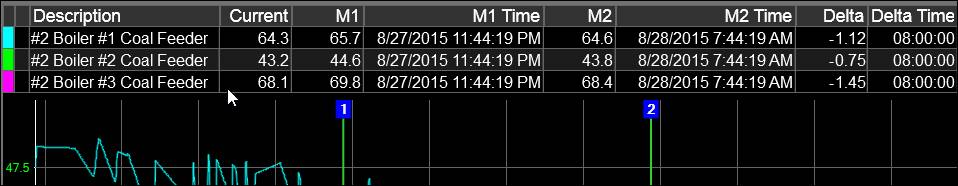
M1: The value of each tag at the first marker.
M1 Time: The timestamp of the first marker.
M2: The value of each tag at the second marker.
M2 Time: The timespan of the second marker.
Delta: The difference between the values of the tag at the two markers.
Delta Time: The difference between the timestamps of the two markers. If the difference is greater than 24 hours, no time is displayed. Double-clicking opens a standalone clone for the tag.
Resize Columns
The columns of the Tag Info grid can be resized by clicking between the columns when the double-headed arrow appears and dragging the column left or right. Double-clicking when the double-headed arrow appears automatically resizes the column.
Default column widths for new trends can be set in System Defaults.
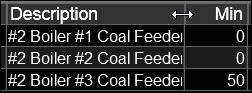
Hide Header
Right-click a tag info grid column header to Hide the header row. Enable the Show Description Line option in the Tag Info Grid Properties shows the row again.
Drag and Drop
Drag and drop tags directly from the tag info grid on to other trends or PARCview displays (note: click and drag from the Description field; clicking the Name field allows editing of the tag name). Holding CTRL while dragging and dropping onto another trend copies the tag and all its properties, instead of using the default. Holding ALT while dragging and dropping onto another trend moves the tag (deletes from the original and adds to the new).