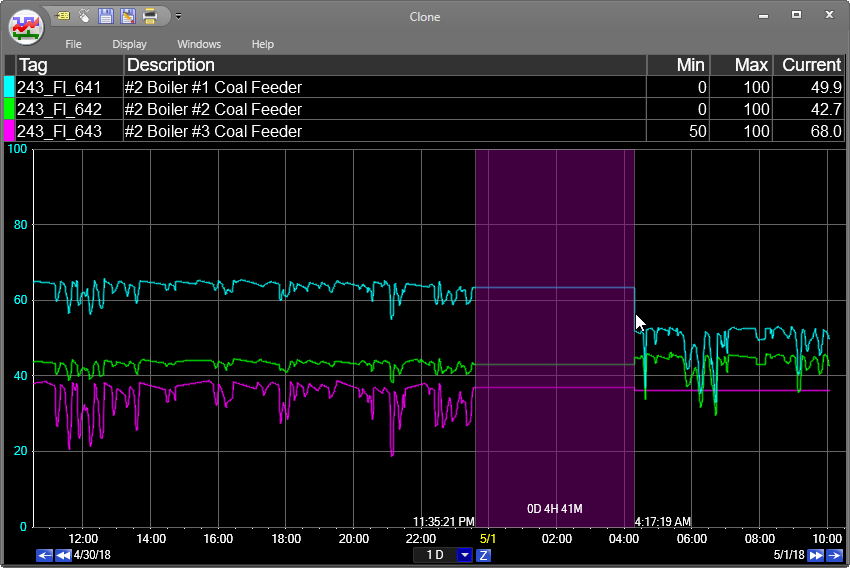
The Plot Area displays the trend lines in a time-based graph. The Y-axis can contain ranges for a single tag or for all the tags. The Y-axis color matches the color of the corresponding trend line. On the bottom of the plot is an X-axis showing times. Using the controls beneath the X-axis, a user can pan forward and backwards in time. These controls and axis labels can be hidden using the Trend Config properties.
Click and drag on the plot area to highlight a slice of time. This is used when zooming or saving manual alarm events.