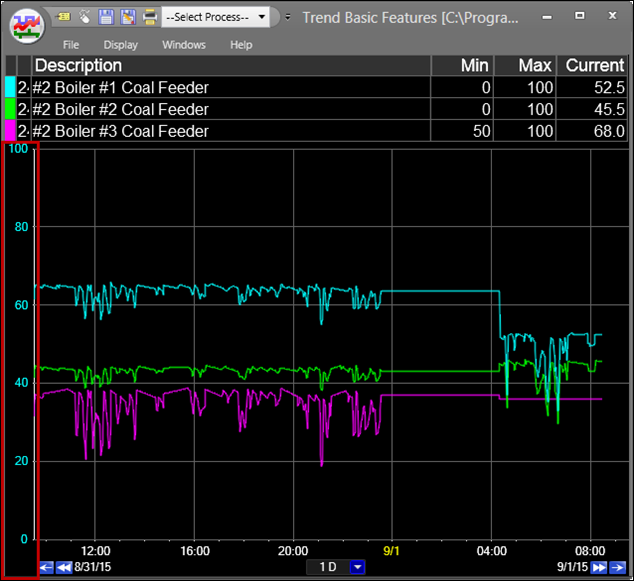
The Trend’s Y-axis displays the value ranges for the tags in the trend. Each tag is plotted independently with its own value range, shown in the Min and Max fields of the Tag Info Grid. By default, the values shown on the Y-axis are for the tag selected in the tag grid, but it can be configured to show value ranges for all tags or for no tags.