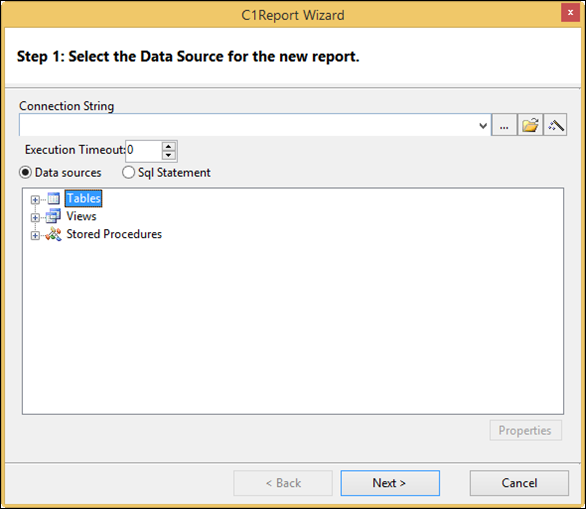
The Report Wizard is used to create new reports.

•Connection String: The DSN goes in the field labelled Connection String and can be a provider string or path to a UDL file (as shown above). Whichever is chosen, it should provide a way for any given client to access the queried database. If a UDL is to be used, there is a button to the right that allows browsing to the UDL file. Note however that this path must be available to all users, so it should be specified as a UNC path if many clients will use the report. UDL files, such as what is used to connect to the PARCview database, are traditionally kept in the application server share in this path: \\SERVER NAME\Capstone\dataPARC\db
o Build Connection String: Opens the Windows Data Link Properties window.
o Select UDL file: Opens the file browser to the \\SERVER NAME\Capstone\dataPARC\db folder to select a UDL file.
o Build SQL Statement:
Clicking the  button
opens a Query Wizard that can be used if a SQL statement has not already been
prepared for the report. It is far more limited than building a query from
scratch in an IDE such as SSMS, but can be a good way to see how a SQL statement
might be started.
button
opens a Query Wizard that can be used if a SQL statement has not already been
prepared for the report. It is far more limited than building a query from
scratch in an IDE such as SSMS, but can be a good way to see how a SQL statement
might be started.
•Execution Timeout: The amount of time the wizard will run the SQL statement before stopping.
•Data Sources: Using the Data Sources radio button allows the report to return all of the data from a single table or view in the database.

•SQL Statement: Enter a query in the text box to return data from the database.


•Double Right Arrow (>>): Adds all available fields to the Detail section of the report. One row in the results of the report query corresponds to a single row in the detail section.
•Double Left Arrow (<<): Removes all fields from the report.
•Groups: Populate this field by dragging fields into the Group box. Grouping by fields creates sections in the report, with each unique value for the group field creating a new section.
A layout and orientation must be assigned to the document. A preview of the layout will appear in the window.

•Layout: How the fields and controls will be arranged in the report.
o Columnar: The columnar layout displays the headers to the left of the data and lists the data in a column.
o Tabular: The tabular layout displays the headers once at the top of the pages and the data is listed in rows beneath the headers.
o Justified: The justified layout displays the headers above the data at every data entry.
o Labels: The labels layout is similar to the columnar layout, but it only displays the text and has no headers or footers. It is intended for printing off labels to turn into stickers, etc. Use grouping to define the content on individual stickers.
•Orientation: The direction that content will be read down the report.
o Portrait: Changes the size of the report to accommodate portrait-style printing.
o Landscape: Changes the size of the report to accommodate landscape-style printing.
•Adjust Fields to Fit Page: Turning this setting on auto-sizes the fields and headers to fit on the size of the page specified..
A style template must be selected for the report. The style will assign default colors and fonts to the fields of the report.

The final step of creating a new report is to name it. Naming a report does not save the file.
