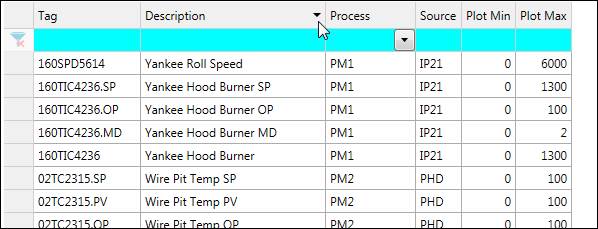
The tag table’s columns contain information about each row’s tag.
Click a column header to sort by the values in that column. Click and drag a column header to rearrange the column order. Click and drag between columns to resize.
Right-click a column header to customize the tag grid’s columns.
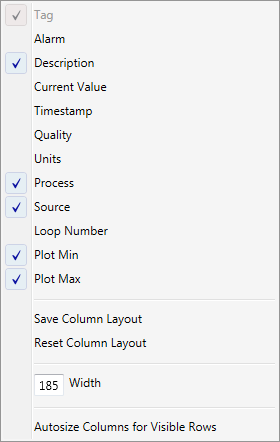
Tag: The short tag name.
Alarm: If checked, show rows for alarm tags. The alarm name will appear in this column. See Alarm Configuration for more information on alarm tags.
Description: The long description to explain the tag.
Current Value: Last value of the tag.
Timestamp: Timestamp of the last value.
Quality: Quality of the last value.
Units: The unit type of the tag’s values, if applicable.
Process: Process area to which the tag has been assigned.
Source: Data source of the tag.
Loop Number: This is accessible in the Master tab. It is the OPC tag name/loop number.
Plot Min: The Y-axis minimum when the tag is in a trend.
Plot Max: The Y-axis maximum when the tag is in a trend.
Save Column Layout: Save current column layout in client settings.
Reset Column Layout: Reset column layout to default settings.
Width: Manually specify the width of the selected column.
Autosize Columns for Visible Rows: Automatically resize columns to nicely accommodate all visible values.